Select the ANALYSIS pull-down menu in PIE and select the "DIAGNOSTIC" option. This will display a set of graphics functions (the floating 'toolbar' at the bottom of the main window) that allow you to draw lines on the plot.
It is not possible to make a reliable estimate of the storage coefficient when the data does not show a unit-slope or the well-bore storage coefficient is changing. In this case, the time at which well-bore storage effects end should be estimated by entering a calculated storage coefficient. Follow these steps to enter the C(min) value we calculated earlier:
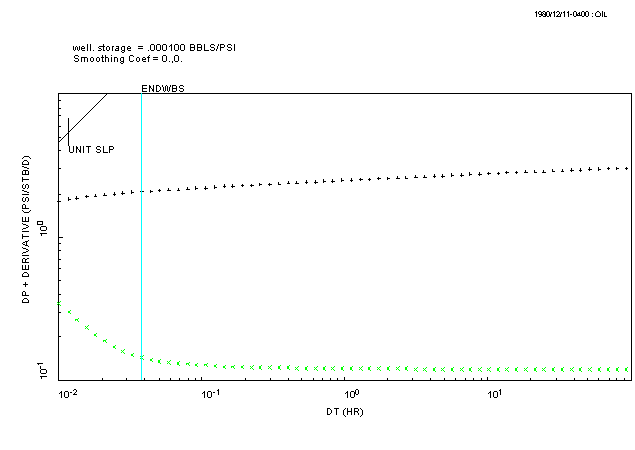
The end of well-bore storage effects is calculated from the C(min) value and a vertical line is drawn to show this time on the plot. The end result of these steps should look something like this:
WRITE DOWN the number of log-cycles on the time axis between the
"ENDWBS" line and the end of the test data (the above
figure shows a value of just under 3.5 log-cycles). We need this
value later.
Q: Do all the data points lie to the RIGHT of the unit-slope line?
A1: Yes, the data is to the right of the line...
A2: No, quite a few data points lie to the other side of the line...